From the Debug menu select Debug project.
Alternatively you can click the
 button in the main toolbar.
The TASKING Debug perspective is associated with the TASKING C/C++ Debugger. Because the TASKING C/C++ perspective is still active, Eclipse asks to open the TASKING Debug perspective.
Optionally, enable the option Remember my decision and click Yes.
The debug session is launched. This may take a few seconds.
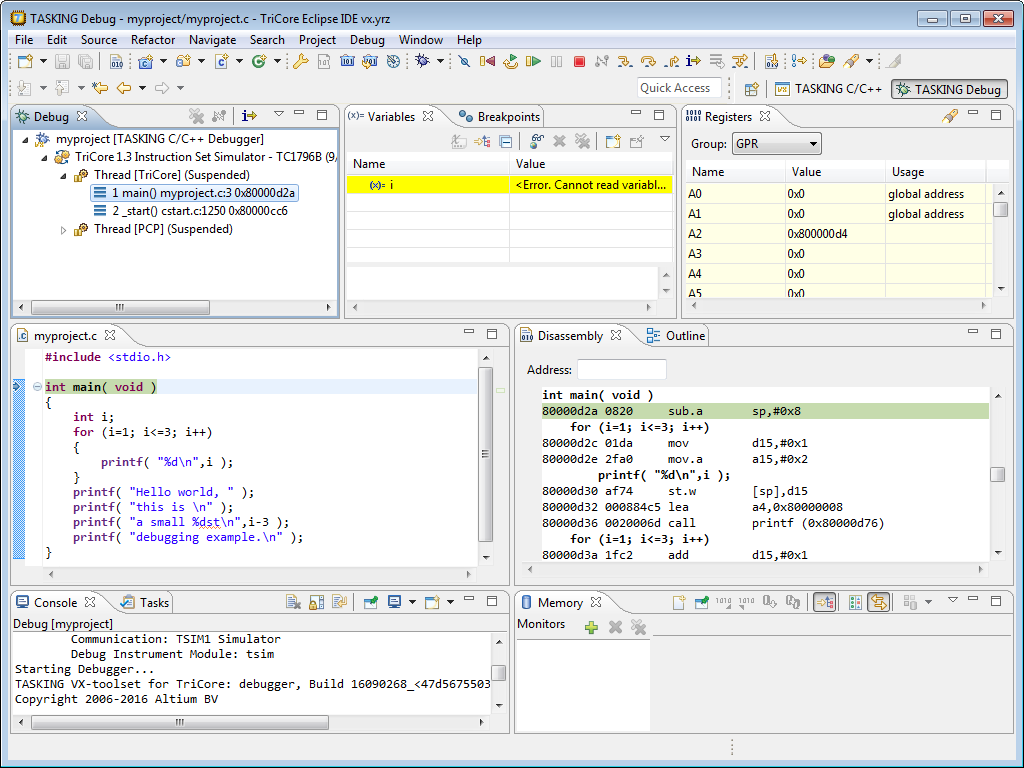
The Debug view shows your running application. Because of the settings in the debug configuration, execution has suspended at the first instruction in the function
main().The Editor view shows the C source files of your application and shows the line where the execution has suspended.
The Variables view shows the variables in your application; in this case
int i.
Debugging a PCP project
When you use the simulator, the Debug view will show the TriCore core and the PCP as separate threads. When you select a thread this changes the context in the Disassembly view.
